A detailed picture of the brain’s cell-type architecture is essential for gaining further insight into both how the brain functions and questions relating to the neurobiology of disease. The mouse brain is an intricately structured collection of hundreds of million cells, functionally classified into neurons, glia and vasculature-related support cells. Within each broad class, there is a dizzying richness of diverse cell types that is only beginning to be probed by techniques such as single-cell RNA sequencing (scRNAseq).
Prior attempts to quantify the cell-type composition of the brain have been limited in both the spatial resolution of the resulting atlas, and the number and specificity of the cell types mapped. To address this gap in knowledge, Christopher Mezias, PhD (now at Cold Spring Harbor Laboratory) and Justin Torok, PhD, under the supervision of Ashish Raj, PhD, professor at UCSF Radiology, UCSF Center for Intelligent Imaging (ci2) member and director of the UCSF Radiology Brain Networks Lab, co-led the development of a computational pipeline, Matrix Inversion and Subset Selection (MISS), which produces maps of cell-type distributions from gene expression data.
Their results were recently published in Proceedings of the National Academy of Sciences and represent the first quantitatively verified atlas of a comprehensive collection of neural cell types across the entire brain.
Subset selection is key for producing high-quality maps
MISS employs a mathematical technique known as deconvolution, to determine the proportions of cell types contained in spatially distributed samples of whole-genome gene expression, using a library of gene profiles of individual cell types. Both datasets were obtained courtesy of the Allen Institute of Brain Sciences. Their gene expression atlas contains maps of over 4,000 genes across the entire mouse brain at 200-μm resolution, while their single-cell RNA seq library genetaically profiles 25 different neuronal and non-neuronal cell types.
Unique to MISS among deconvolution techniques, however, is the incorporation of subset selection, which filters out low-information and noisy genes prior to the deconvolution step. Using an information-theoretic algorithm to identify a minimal set of genes that are maximally useful for mapping cell types, MISS then performs deconvolution to achieve brain-wide maps of cell types that are quantitatively superior to previous attempts.
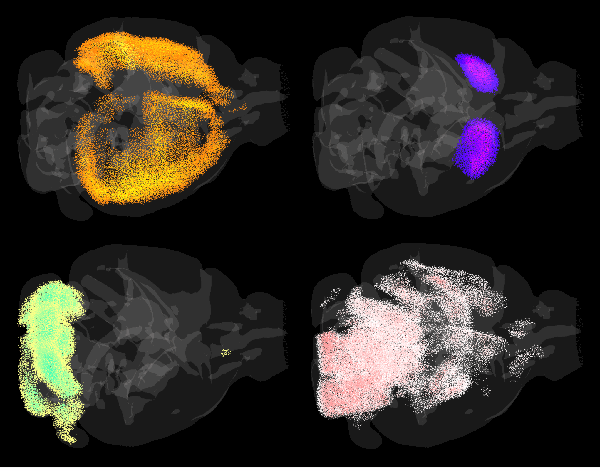
Notably, they show that MISS-derived maps of neocortical interneurons strongly agree with previously published distributions and are able to reconstruct the laminar architecture of the neocortex using layer-specific glutamatergic neurons. Compared with other methods, MISS is more highly sensitive to true signal coming from specific cell types while minimizing off-target predictions.
Using the MISS atlas to answer long standing neuroscientific questions
The MISS cell-type atlas represents a significant leap forward towards understanding the cellular architecture of the mammalian central nervous system. Already, researchers in the Raj lab are leveraging this resource to interrogate the role regional cell-type composition plays in shaping how the mouse brain is wired at a mesoscopic level. Additionally, they are exploring the roles of specific neuronal and non-neuronal cell types in neurodegenerative disease, marrying the concept of selective vulnerability to the network-based spread models Dr. Raj has pioneered for explaining the spatiotemporal progression of neuropathology in Alzheimer’s disease, Parkinson’s disease, and amyotrophic lateral sclerosis. However, their ultimate goal is to use the MISS approach on human gene expression data.
“The ‘holy grail’ of this research is to produce maps of the cell-type distributions in the human brain,” says Torok. “We still lack the experimental tools to directly map human neural cell types at a whole-brain scale, but with MISS, we can use existing gene expression data to computationally determine where the cell types of the human brain reside.”
Additional authors of the study include Pedro Maia, PhD of the University of Texas at Arlington and Eric Markley, of UC Berkeley. This work was supported by NIH grants R01NS092802, RF1AG062196, R56AG064873, and R01AG072753.